| Explanatory variables. Whenever we consider two records relating to the same kind of entity, the pair is either matched or unmatched. They are matched when they represent the same entity in the real world and unmatched when they don’t. To study this characteristic of a pair statistically, we set up a variable that is true if the pair is matched and false if the pair is unmatched. This is the salient characteristic of what statisticians call the explanatory variable. It is the value of this variable that the statistics are supposed to explain. The statistics will help us, for example, to determine the probability that the pair is matched (or unmatched). The investigator must only assume that this value is an inherent property of the pair, that the fact that the pair is matched (or not) explains why her measurements come out the way they do. |
| Response variables. Whenever we consider two records relating to the same kind of entity and take measurements on their similarity, etc., we can say only that the pair is either linked or unlinked. The variable that has this value is a so-called response variable. If the value of this linked-or-not response variable is true, then with a certain probability this value is explained by the fact that the value of the matched-or-not explanatory variable is also true. Suppose that the system determines that the probability of a particular linked pair being matched is less than the probability of its being unmatched. Then the pair was probably linked in error. Similarly the system may classify some pairs as unlinked when they are in fact matched. In this case it has missed linking the matched pair. Depending on the application, one may specify the acceptable probabilities. Then by continually adjusting and improving the measures on the records, duplicate detection may classify accurately to any desired degree of certainty. |
| Measuring agreement and disagreement. We measure three parameters to get at matching. |

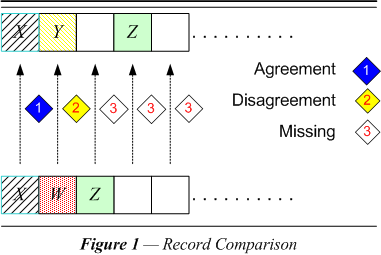
| Figure 1 diagrams the three results that may come about when record linkage compares the values in corresponding fields of two records. It depends on the field being compared, but in the many cases when the values in the corresponding fields agree, the records are more likely matched than not. (NB: The values must be distinctive.) Full agreement means that the form of the data (and in this case probably also the meaning, i.e., what it refers to in the real world) is identical. Each field whose values agree contributes a certain probability in favor of linkage and each field that disagrees contributes a certain probability against linkage. One might compare the situation to members of a committee who each register a vote, either for or against linkage. It is also possible to abstain. This is the case where there are no data in the field — it can neither agree nor disagree. Actually the analogy should be more like the votes of shareholders in a company, since one field may count more heavily than another. (NB: This analogy also fails when we examine all the ways in which our measures might contribute to the strength of a vote. Sometimes a vote may be stronger against than the corresponding vote in favor could be, and vice versa.) |
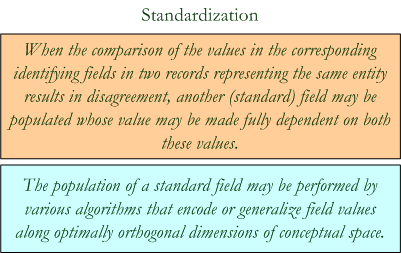
| Various strengths of data. Depending on how valuable the field is (and there are measures for this, e.gg., distinctiveness of possible data values, reliability of the data, etc.), it could rate anywhere from very heavily against linkage to abstention to very heavily in favor of linkage (non-coincidental). There may also be measures on the extent to which the data in the field agrees — partial agreement. Some differences in form, such as abbreviations, may usually reflect no difference in meaning (what it might refer to). But some differences, such as "Nancy" for "Ann," may also be made to affect the strength of the vote. When all the votes are in, the strength of the vote should correspond to a probability that the pair being compared is a match. If the probability is high enough, if it comes above a particular threshold, the comparison counts as linked. Implementation of partial agreement takes the form of populating an additional identifying field (naturally value dependent), which may agree (fully) when the original field disagrees (fully). |

| An additional example may appear with the approximate year of an event. The year may have a precision of ±3 (its standard year range) so that it agrees partially with any year in the range, or any approximate year whose precision range overlaps. How close the years are would then represent a degree of agreement. |
| Availability of data. Sometimes the reason we cannot determine whether there is agreement or disagreement in the data values in a field of a record is that there is no value — data is simply not present. The absence of data makes for uncertainty about matching; this contributes to the imperfect mapping between field agreement and record matching. When both members of a record pair have no data value in a particular field, the field cannot contribute to our judgement as to whether the pair is matched or not. The easiest way to handle this situation is to disallow a blank field in one record “agreeing” with a blank or anything else in the corresponding field of another record. A blank in one or both of the fields being compared should make agreement in our sense indeterminate. |
| Relating the three attributes of a comparison. |

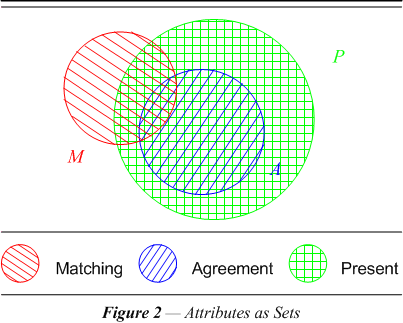
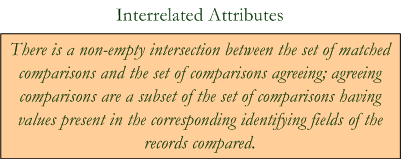
| Figure 2 is a Euler diagram of the above three categories of record comparisons as sets. The circles are sets of points intended to help fix in the mind the relationships among the three categories of interest in record linkage. In this particular situation the sets are arranged so that there are some comparisons (points) in each category but not in every combination of categories. A comparison may represent the same entity (matched, M) and yet have data missing in one or both records (absent, ¬P). In this case the comparison would be represented by a point inside the circle marked M, but not also inside P. When a field’s data is missing in one or both records, the field will not be able to contribute to the decision about the record being matched. In the diagram there are points that are not contained in A, i.e., representing non-agreement, ¬A, that are also not in P. The points outside A that concern us most represent disagreement. These points must also be inside P, i.e., the intersection of P with ¬A. If the data is missing, i.e., not present, ¬P, it can neither agree nor disagree. So non-agreement is not the same as disagreement. When one or both of the fields are blank we cannot compare the data. We will have to be careful to define agreement and disagreement only for records where the data is present. Hence, we are defining A as a subcategory or subset of P. Only part of the set ¬A is the set representing disagreement, namely P with ¬A. |
