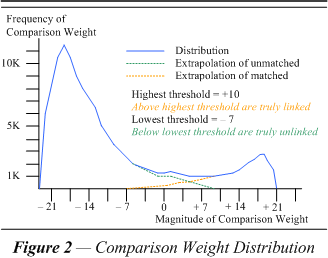

In this case we do not have a model for the frequency density distribution. This means that we can only guess at the two curves underlying the two modes. A conservative estimate is outlined on the figure with the dotted lines. The green line is a pretty much minimal estimate of the intrusion of the unmatched on the matched, and the orange, the matched on the unmatched. Aiding this guess is an important observation: the proportion of linked to unlinked at zero should be about the same as the proportion of the two totals.